Using Moving Averages for Trend Analysis
Introduction
Moving averages are a popular technical analysis tool used by traders and investors to identify trends in financial markets. By smoothing out price data over a specified period, moving averages help to filter out short-term fluctuations and provide a clearer picture of the underlying trend. In this article, we will explore how moving averages can be effectively used for trend analysis.
Understanding Moving Averages
Before delving into their application, it is essential to grasp the concept of moving averages. A moving average is calculated by averaging the closing prices of a financial instrument over a specific time frame. As new data points are added, the oldest data points are dropped, creating a moving window of averaged prices.
Types of Moving Averages
There are various types of moving averages, but the two most commonly used ones are the simple moving average (SMA) and the exponential moving average (EMA). The SMA assigns equal weight to each data point in the calculation, while the EMA assigns more weight to recent data points, making it more responsive to changes in price.
Identifying Trends with Moving Averages
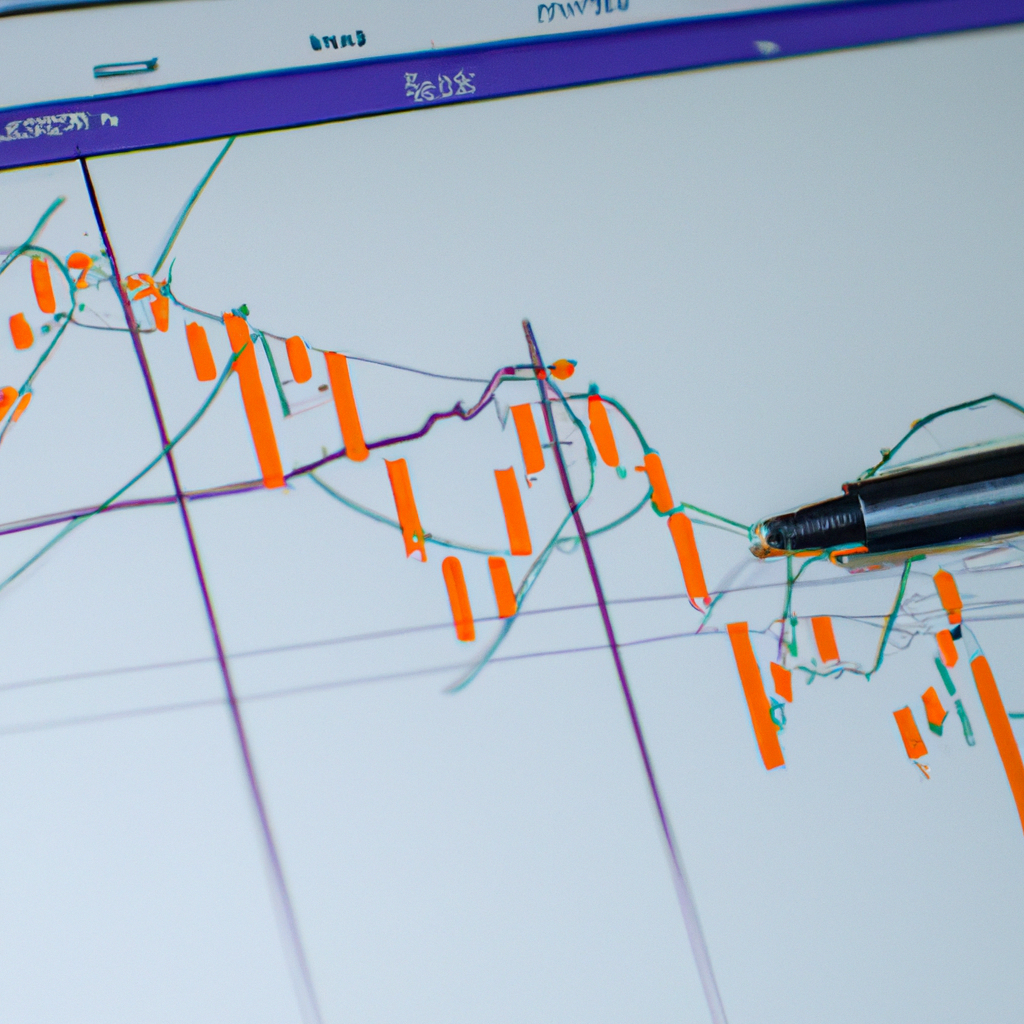
Moving averages are primarily used to identify trends in financial markets. By plotting moving averages on a price chart, traders can observe the direction and strength of the trend.
Determining Trend Direction
To determine the trend direction using moving averages, traders often look for crossovers between different moving averages. When a shorter-term moving average (e.g., 50-day SMA) crosses above a longer-term moving average (e.g., 200-day SMA), it is considered a bullish signal, indicating an uptrend. Conversely, when the shorter-term moving average crosses below the longer-term moving average, it is a bearish signal, indicating a downtrend.
Confirming Trend Strength
Moving averages can also help traders gauge the strength of a trend. Steeper moving averages and wider gaps between different moving averages suggest a stronger trend, while flatter moving averages and narrower gaps indicate a weaker trend.
Using Moving Averages as Support and Resistance Levels
Moving averages can also act as support or resistance levels. In an uptrend, the moving average often acts as a support level, where prices tend to find buying interest and bounce higher. In a downtrend, the moving average can act as a resistance level, where prices face selling pressure and struggle to move higher.
Conclusion
Moving averages are powerful tools for trend analysis in financial markets. By smoothing out price data and identifying trend direction and strength, moving averages help traders make informed decisions. Whether used alone or in conjunction with other technical indicators, moving averages provide valuable insights into market trends and can significantly enhance trading strategies.