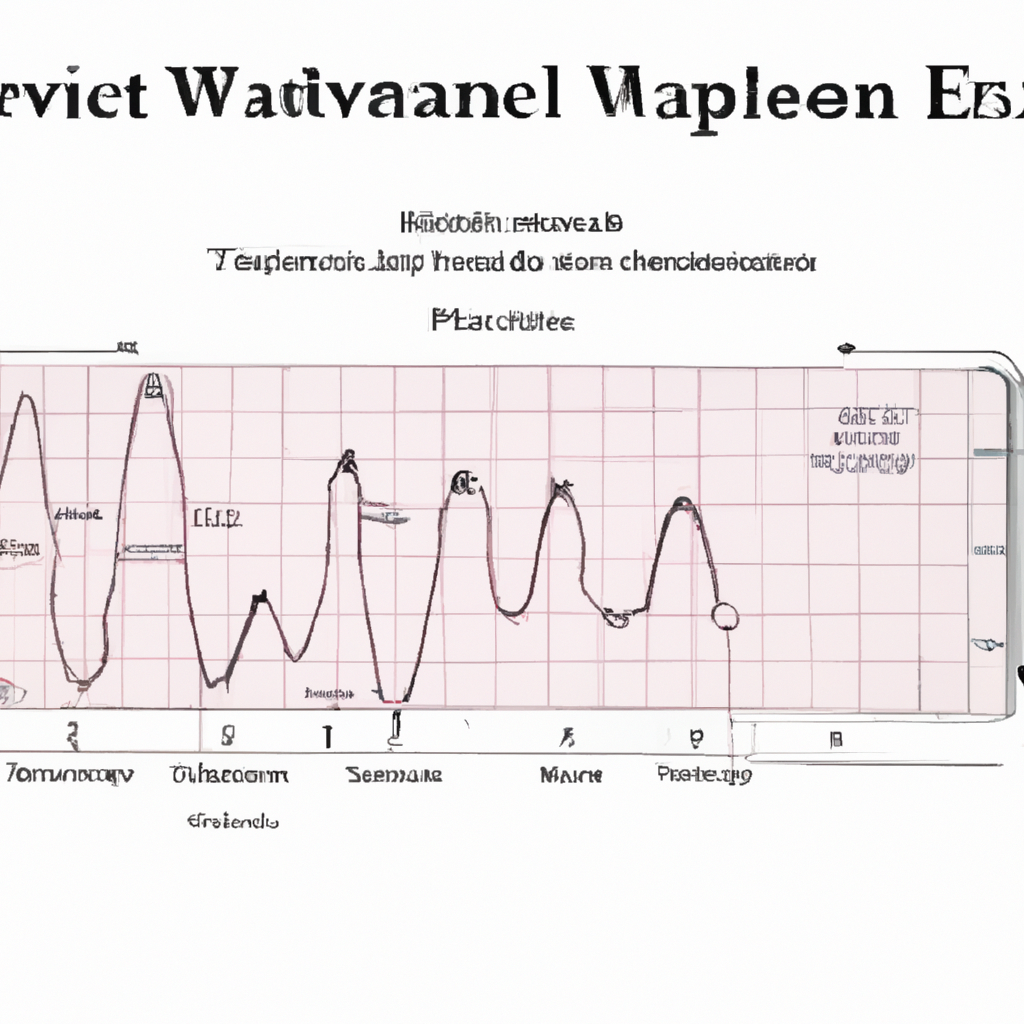
Elliott Wave Analysis Methods: A Comprehensive Guide
Introduction
Elliott Wave analysis is a powerful tool used by traders and investors to predict future price movements in financial markets. Developed by Ralph Nelson Elliott in the 1930s, this technique is based on the belief that market prices follow specific patterns and waves. By understanding these patterns, traders can gain valuable insights into market trends and make informed trading decisions. In this article, we will explore the various methods used in Elliott Wave analysis and how they can be applied effectively.
1. Wave Identification
The first step in Elliott Wave analysis is to identify the different waves within a market trend. This involves recognizing the impulse waves (trending moves) and corrective waves (counter-trend moves). Impulse waves are further divided into five smaller waves labeled as 1, 2, 3, 4, and 5, while corrective waves consist of three smaller waves labeled as A, B, and C. By identifying these waves, traders can determine the overall structure of the market and anticipate its future direction.
2. Fibonacci Retracement
Fibonacci retracement is a widely used tool in Elliott Wave analysis. It helps traders identify potential support and resistance levels within a market trend. The key Fibonacci levels include 23.6%, 38.2%, 50%, 61.8%, and 78.6%. Traders use these levels to determine where a corrective wave is likely to end and the next impulse wave to begin. By combining Fibonacci retracement with wave identification, traders can pinpoint optimal entry and exit points for their trades.
3. Wave Extension
Wave extension is another important concept in Elliott Wave analysis. It occurs when one of the impulse waves extends beyond the expected length, indicating a strong trend. Traders can identify wave extensions by measuring the length of the previous wave and projecting it onto the current wave. This technique helps traders anticipate the magnitude of a price move and adjust their trading strategies accordingly.
4. Wave Oscillator
Wave oscillators are technical indicators used to confirm Elliott Wave patterns. They help traders identify the strength and momentum of a price move, providing additional confidence in their analysis. Popular wave oscillators include the MACD (Moving Average Convergence Divergence), RSI (Relative Strength Index), and Stochastic Oscillator. By using these indicators in conjunction with Elliott Wave analysis, traders can validate their predictions and make more accurate trading decisions.
5. Time Analysis
In addition to price analysis, Elliott Wave theory also emphasizes the importance of time. According to Elliott, waves tend to unfold in specific timeframes, creating a cyclical pattern. By analyzing the duration of each wave, traders can anticipate when the next wave is likely to occur, providing them with a timing advantage. Time analysis can be done using various techniques, such as measuring the duration of previous waves or identifying recurring patterns in historical price data.
Conclusion
Elliott Wave analysis offers traders a systematic approach to understanding market trends and predicting future price movements. By mastering the various methods discussed in this article, traders can gain a significant edge in their trading strategies. However, it is important to note that Elliott Wave analysis is not foolproof and requires practice and experience to be effectively applied. As with any trading tool, it is recommended to combine Elliott Wave analysis with other technical and fundamental analysis techniques for a well-rounded trading approach.
