Introduction to Elliott Wave Analysis
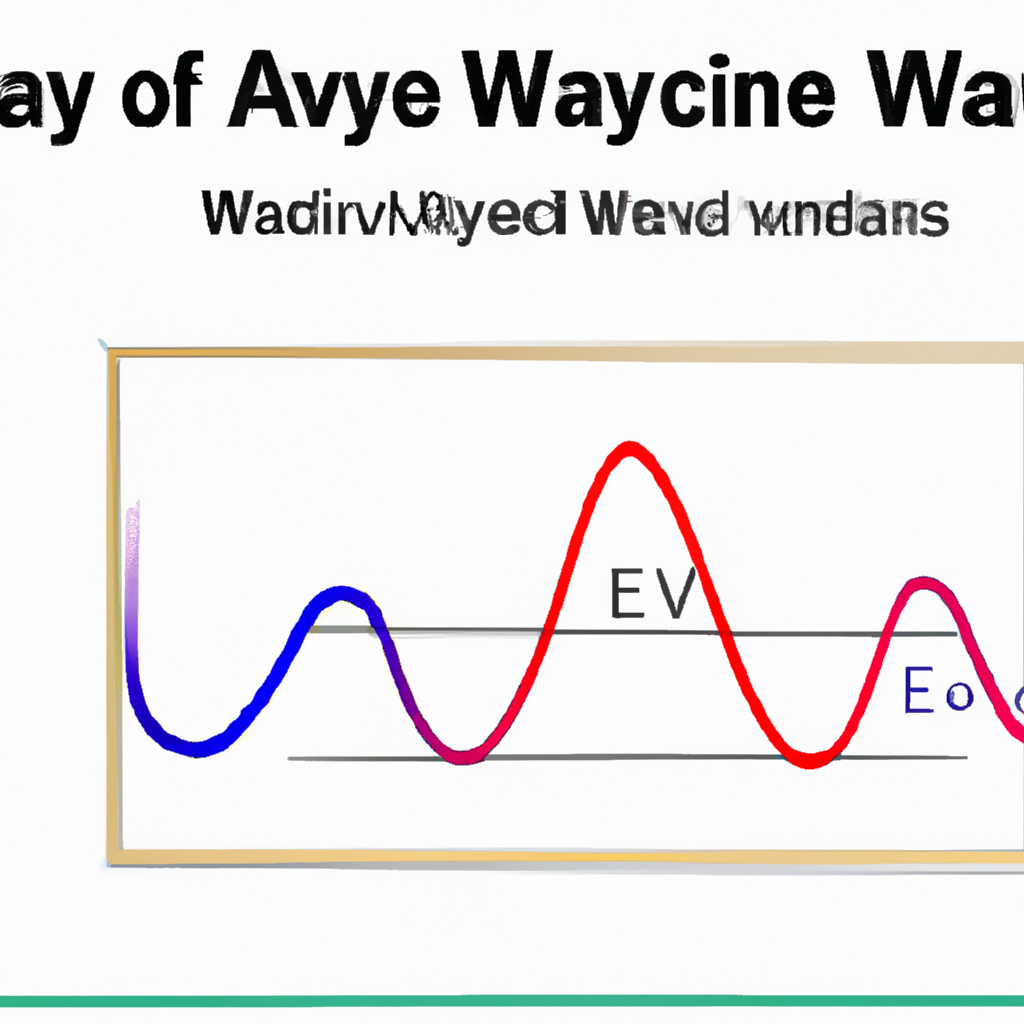
Elliott Wave analysis is a technical analysis method that financial analysts and traders use to forecast market price movements. Pioneered by Ralph Nelson Elliott in the 1930s, it is based on the theory that market prices unfold in specific patterns, known as “waves.” According to Elliott, these waves reflect the natural rhythm of the collective psychology of buyers and sellers. Understanding these patterns can offer insights into market trends and potential turning points, making it a valuable tool for traders aiming to optimize their strategies.
Basic Concepts of Elliott Wave Analysis
At the heart of Elliott Wave Theory are a few key concepts that are critical to understanding how to apply this analysis method effectively.
The Wave Principle
Elliott’s Wave Principle posits that market movements can be predicted by identifying a repetitive pattern of eight waves – five in the direction of the trend, known as “impulse waves,” followed by three corrective waves. This 5-3 wave structure forms the basis of the market cycle.
Fractal Nature
Waves are fractal in nature, meaning they can exist within larger waves and contain smaller waves within themselves. This characteristic allows Elliott Wave analysts to study market movements on different time frames – from decades down to minutes.
Applying Elliott Wave Analysis
Employing Elliott Wave Analysis involves several steps, from identifying wave patterns to interpreting the findings within the context of market dynamics.
Identifying Wave Patterns
The first step in using Elliott Wave analysis is to identify the starting point of a wave sequence. Analysts look for the initial five-wave move in the direction of the trend followed by a three-wave corrective phase. This can often be challenging and requires practice to discern the waves accurately.
Wave Counting
After identifying the potential waves, the next step is “wave counting.” This involves labeling the waves in the 5-3 pattern and observing the relationships between them. Each wave has characteristics that help distinguish it from others, such as wave length and complexity.
Applying Fibonacci Ratios
Fibonacci ratios are an essential part of Elliott Wave analysis. They help to determine the potential end points of waves by applying specific mathematical ratios that are commonly found in nature. For instance, retracement levels and projection targets are calculated to forecast where a wave might end.
Limitations and Challenges
While Elliott Wave Analysis can be a powerful tool, it is not without its limitations and challenges. The subjective nature of wave identification and counting can lead to different interpretations by analysts. Moreover, external factors such as news events can disrupt wave patterns, making them harder to predict with accuracy. It requires a great deal of practice, patience, and experience to master.
Conclusion
Elliott Wave Analysis offers a unique perspective on market dynamics, grounded in the natural rhythms and patterns of market participant behavior. While it may be complex and requires a steep learning curve, its proponents argue that it provides a comprehensive framework for understanding market movements. As with any analysis method, it should be used as part of a diversified trading or investment strategy, taking into account other technical indicators, fundamental analysis, and risk management principles.
