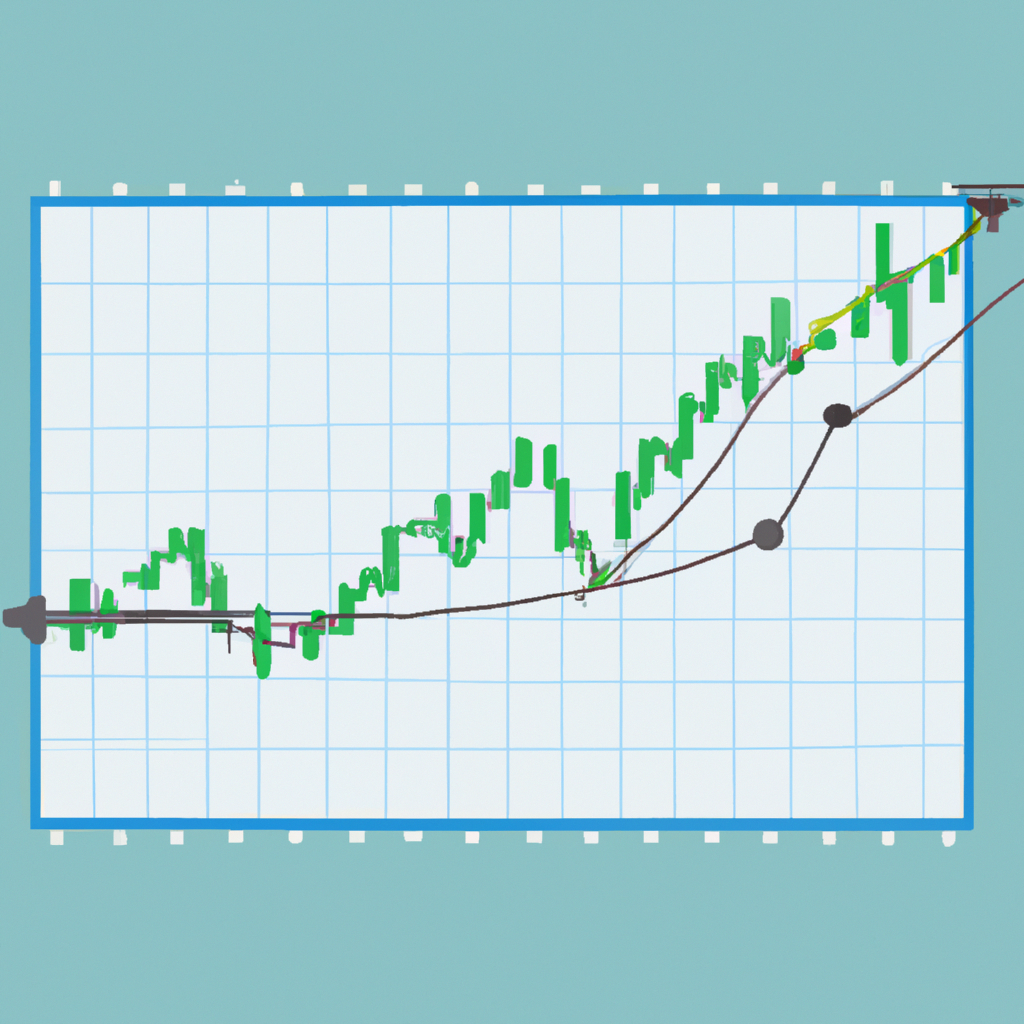
Trend Analysis Using Moving Averages
Introduction
Trend analysis is a powerful tool used by traders and investors to identify the direction and strength of a market trend. One popular method of trend analysis is using moving averages. Moving averages help smooth out price data and provide a visual representation of the overall trend.
What are Moving Averages?
Moving averages are calculated by taking the average price of a security or asset over a specific period of time. The most commonly used moving averages are the simple moving average (SMA) and the exponential moving average (EMA).
Simple Moving Average (SMA)
The SMA is calculated by adding up the closing prices of a security over a specified number of periods and then dividing the sum by the number of periods. For example, to calculate a 50-day SMA, you would add up the closing prices of the last 50 days and divide the sum by 50.
Exponential Moving Average (EMA)
The EMA gives more weight to recent prices, making it more responsive to changes in the trend compared to the SMA. It is calculated using a formula that incorporates a smoothing factor, which determines the weight given to each price point. The EMA is more commonly used by traders due to its ability to react quickly to market changes.
Using Moving Averages for Trend Analysis
Moving averages can be used in various ways to analyze trends in the market. Here are a few common techniques:
Identifying the Overall Trend
By plotting a moving average on a price chart, you can visually determine the overall direction of the market. If the price is consistently above the moving average, it indicates an uptrend. Conversely, if the price is consistently below the moving average, it suggests a downtrend.
Signal for Buying or Selling
When the price crosses above the moving average, it may signal a buying opportunity. Conversely, when the price crosses below the moving average, it may indicate a selling opportunity. Traders often use this crossover as a signal to enter or exit a trade.
Identifying Support and Resistance Levels
Moving averages can act as support or resistance levels. If the price bounces off a moving average multiple times, it suggests a strong support or resistance level. Traders often use these levels to set stop-loss orders or take-profit targets.
Conclusion
Moving averages are a valuable tool for trend analysis in financial markets. By using moving averages, traders and investors can gain insights into the overall direction of the market, identify potential buying or selling opportunities, and determine support and resistance levels. However, it is important to note that moving averages should be used in conjunction with other technical analysis tools to make informed trading decisions.
