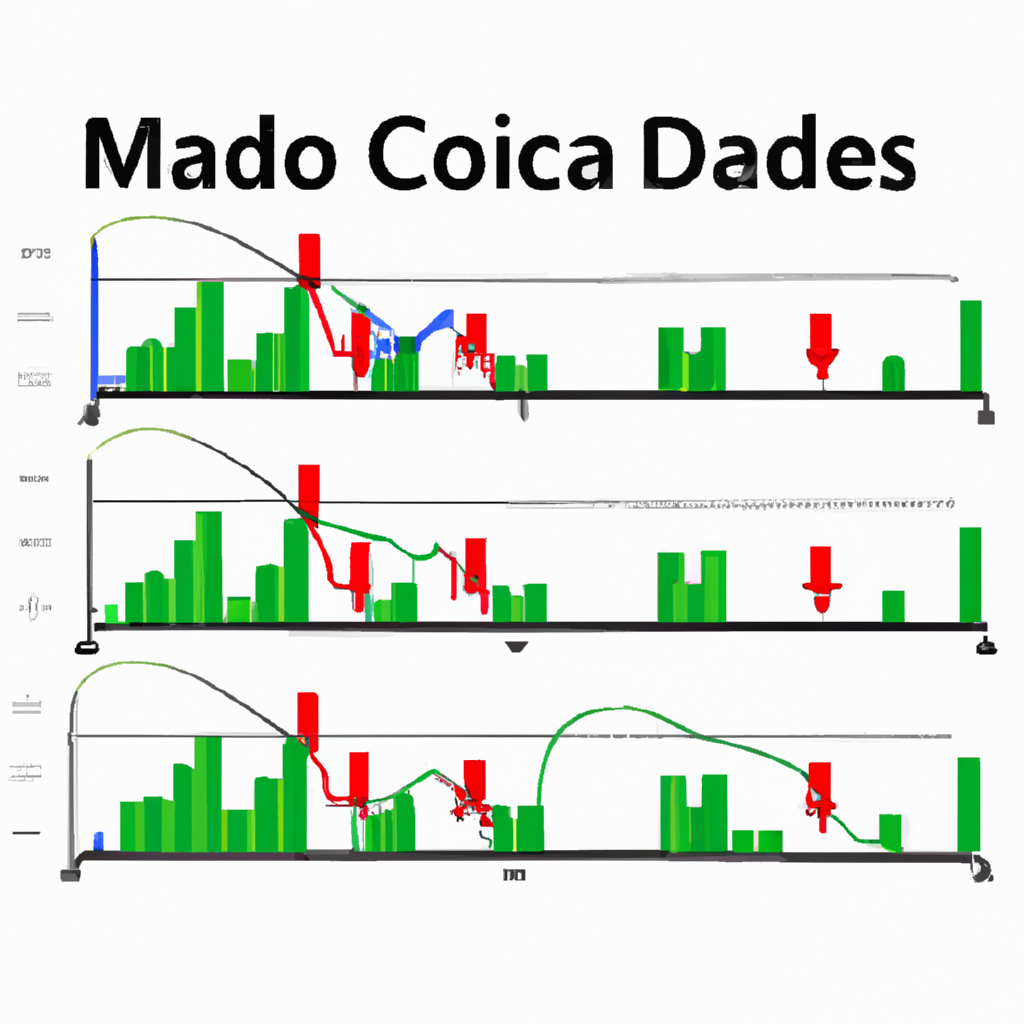
MACD Indicator Signals
The Moving Average Convergence Divergence (MACD) is a popular technical indicator used by traders to identify potential trend reversals, generate buy or sell signals, and confirm the strength of a trend. It consists of two lines, the MACD line and the signal line, along with a histogram that represents the difference between these two lines. Understanding the signals generated by the MACD indicator is essential for successful trading. In this article, we will explore the various MACD indicator signals and how to interpret them.
Bullish Signals
1. Bullish MACD Crossover: When the MACD line crosses above the signal line, it generates a bullish signal. This indicates that the short-term moving average is moving above the long-term moving average, suggesting a potential uptrend. Traders often interpret this as a buy signal.
2. Bullish Divergence: Bullish divergence occurs when the price of an asset is making lower lows, but the MACD indicator is making higher lows. This suggests that the selling pressure is weakening, and a bullish reversal might be imminent. It is considered a strong buy signal.
3. Bullish Histogram Expansion: When the histogram bars start expanding and moving above the zero line, it indicates increasing bullish momentum. This suggests that buyers are gaining control, and a potential uptrend is strengthening. Traders often view this as a confirmation of a buy signal.
Bearish Signals
1. Bearish MACD Crossover: When the MACD line crosses below the signal line, it generates a bearish signal. This indicates that the short-term moving average is moving below the long-term moving average, suggesting a potential downtrend. Traders often interpret this as a sell signal.
2. Bearish Divergence: Bearish divergence occurs when the price of an asset is making higher highs, but the MACD indicator is making lower highs. This suggests that the buying pressure is weakening, and a bearish reversal might be imminent. It is considered a strong sell signal.
3. Bearish Histogram Contraction: When the histogram bars start contracting and moving below the zero line, it indicates increasing bearish momentum. This suggests that sellers are gaining control, and a potential downtrend is strengthening. Traders often view this as a confirmation of a sell signal.
Additional Considerations
1. Confirmation with Other Indicators: While MACD signals can be reliable, it is always recommended to confirm them with other technical indicators or chart patterns. This helps reduce false signals and increases the probability of successful trades.
2. Timeframe Selection: MACD signals can vary depending on the timeframe used. Traders should consider using multiple timeframes to get a broader perspective and avoid making trading decisions solely based on a single timeframe.
3. Market Conditions: Market conditions can influence the effectiveness of MACD signals. During highly volatile or choppy markets, the signals may be less reliable. It is important to adapt and consider the overall market environment when interpreting MACD signals.
In conclusion, the MACD indicator is a powerful tool for traders to identify potential trend reversals and generate buy or sell signals. By understanding and interpreting the various MACD signals, traders can make informed trading decisions and improve their chances of success in the financial markets.