Divergence Signals in Technical Analysis
Introduction
In the world of technical analysis, traders and investors often rely on various indicators and patterns to make informed decisions about buying or selling assets. One such powerful tool is divergence signals, which can provide valuable insights into potential trend reversals or continuations. This article aims to explore the concept of divergence signals and how they can be effectively used in technical analysis.
Understanding Divergence
Divergence occurs when the price of an asset moves in a different direction than a related indicator, such as an oscillator or a moving average. It suggests a potential shift in the prevailing trend and can serve as a warning sign for traders to exercise caution. Divergence signals can be classified into two main types: bullish divergence and bearish divergence.
Bullish Divergence
Bullish divergence occurs when the price of an asset forms lower lows while the corresponding indicator forms higher lows. This indicates that the selling pressure is weakening, and a potential trend reversal towards the upside might be imminent. Traders often look for bullish divergence signals as an opportunity to enter long positions or to add to existing positions.
Bearish Divergence
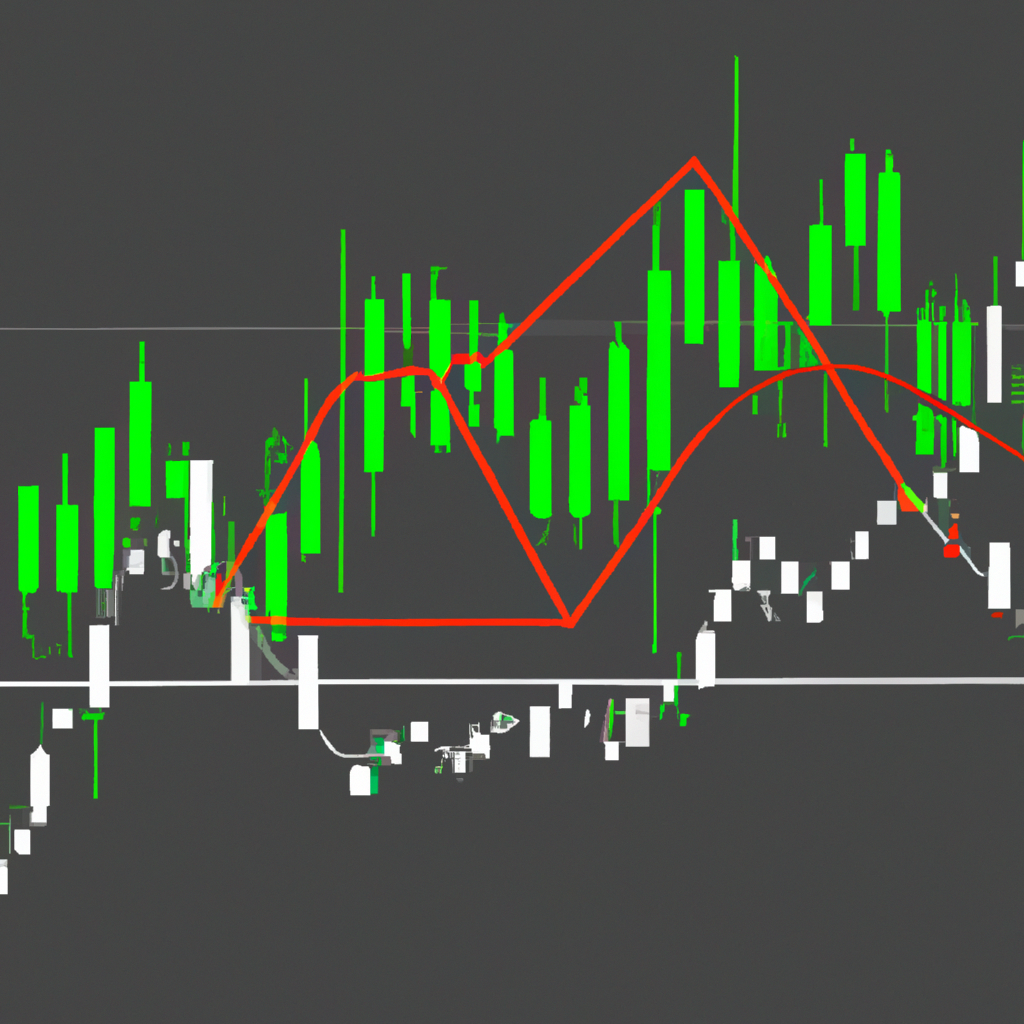
On the other hand, bearish divergence occurs when the price of an asset forms higher highs while the indicator forms lower highs. This suggests that the buying pressure is waning, and a potential trend reversal towards the downside may be on the horizon. Traders often interpret bearish divergence signals as a warning sign to consider selling or reducing their positions.
Identifying Divergence Signals
To effectively identify divergence signals, traders typically use a combination of price charts and technical indicators. Here are a few steps to follow when looking for divergence signals:
1. Choose an appropriate indicator: Select an oscillator or a moving average that is commonly used for divergence analysis, such as the Relative Strength Index (RSI), Moving Average Convergence Divergence (MACD), or Stochastic Oscillator.
2. Compare price action and indicator movement: Analyze the price chart and the selected indicator simultaneously. Look for instances where the price forms higher highs or lower lows while the indicator forms the opposite.
3. Confirm with other indicators or patterns: Divergence signals are more reliable when they align with other technical indicators or chart patterns. Consider using additional tools like trendlines, support and resistance levels, or volume analysis to validate the divergence signal.
Applying Divergence Signals in Trading
Once a divergence signal is identified, traders can use it as a basis for their trading decisions. Here are a few common approaches:
– Entry and exit points: Traders can enter a trade when a divergence signal is confirmed and exit when the price reaches a predetermined target or when another reversal signal emerges.
– Confirmation with other indicators: Divergence signals can be further confirmed by other indicators or patterns. For example, if a bullish divergence is identified, traders might wait for a breakout above a key resistance level to confirm the potential trend reversal.
– Stop-loss placement: To manage risk, traders often place stop-loss orders below the recent swing low (in bullish divergence) or above the recent swing high (in bearish divergence) to protect against potential adverse price movements.
Conclusion
Divergence signals provide valuable insights into potential trend reversals or continuations in technical analysis. By understanding the concept of divergence, identifying divergence signals, and applying them effectively in trading decisions, traders can enhance their ability to spot profitable opportunities and manage risk. However, it is important to remember that no indicator or pattern guarantees accurate predictions, and traders should always use divergence signals in conjunction with other forms of analysis and risk management techniques.