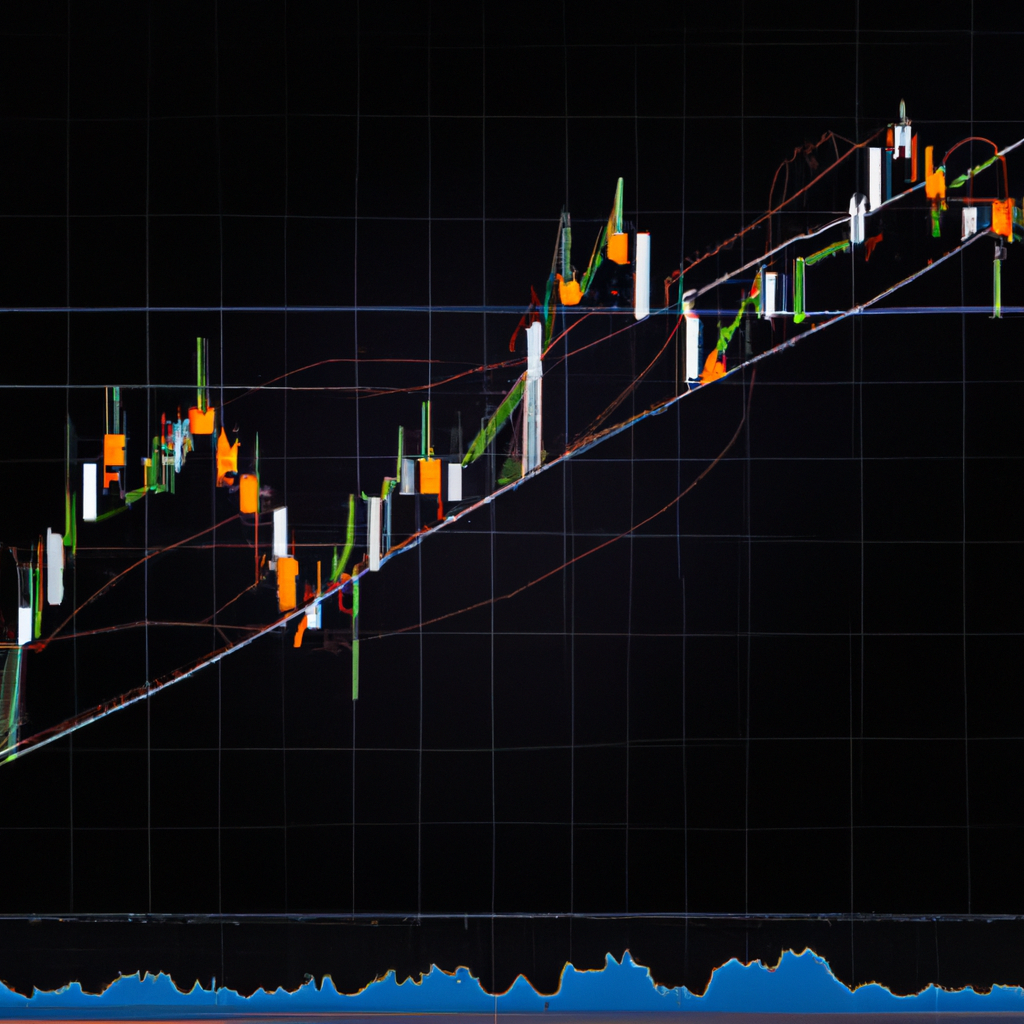
Harmonic Patterns in Trading: Unveiling the Secrets of Market Harmonics
Introduction
Trading in the financial markets can be a complex and challenging endeavor. Traders employ various technical analysis tools to identify patterns and trends that can help them make informed decisions. One such tool that has gained popularity among traders is harmonic patterns.
What are Harmonic Patterns?
Harmonic patterns are a type of technical analysis pattern that traders use to predict potential future price movements in the markets. These patterns are derived from Fibonacci ratios and are believed to represent repetitive price structures that occur naturally in financial markets.
Types of Harmonic Patterns
There are several types of harmonic patterns that traders commonly use. Some of the most popular ones include:
1. Gartley Pattern: The Gartley pattern is one of the most well-known harmonic patterns. It consists of four price swings, forming specific Fibonacci retracement and extension levels. Traders use this pattern to identify potential reversal points in the market.
2. Butterfly Pattern: The butterfly pattern is similar to the Gartley pattern but has different Fibonacci ratios. It consists of five price swings and is often used to identify potential trend reversals.
3. Bat Pattern: The bat pattern is another harmonic pattern that traders use to identify potential reversal points. It consists of five price swings and is characterized by specific Fibonacci ratios.
4. Crab Pattern: The crab pattern is a more complex harmonic pattern that consists of five price swings. It is known for its deep retracement levels and is used to identify potential trend reversals.
How to Trade Harmonic Patterns
Trading harmonic patterns requires a combination of technical analysis skills and pattern recognition. Here are the general steps to trade harmonic patterns:
1. Identify the Pattern: Use technical analysis tools and Fibonacci ratios to identify potential harmonic patterns on price charts. Look for specific price swings and retracement levels that align with the characteristics of the desired pattern.
2. Confirm the Pattern: Once a potential harmonic pattern is identified, confirm it by checking if it meets the necessary Fibonacci ratios and price structure requirements. This step helps ensure the validity of the pattern.
3. Set Entry and Exit Levels: Determine the entry and exit levels for your trade based on the harmonic pattern. This includes setting stop-loss and take-profit levels to manage risk and potential profits.
4. Monitor Price Action: Continuously monitor the price action to ensure that the market is behaving as expected. Adjust your trading strategy if necessary based on new information or market conditions.
5. Execute the Trade: When the price reaches the desired entry level, execute the trade according to your trading plan. Follow your risk management strategy and adhere to your predetermined exit levels.
Conclusion
Harmonic patterns offer traders a unique perspective on market movements by utilizing Fibonacci ratios and repetitive price structures. While they are not foolproof, harmonic patterns can provide valuable insights into potential trend reversals and market opportunities. By mastering the art of identifying and trading harmonic patterns, traders can enhance their technical analysis skills and increase their chances of success in the financial markets.
